Your first 15 minutes
A self-paced walkthrough from first login to reading your first score. No technical background required.
1. Log in
Navigate to the platform URL provided by your Customer Success Manager and sign in with your organizational credentials. If your organization uses SSO, you will authenticate through your existing identity provider.
Once logged in, you land on the main map interface.
2. Get oriented
The platform has three main areas.
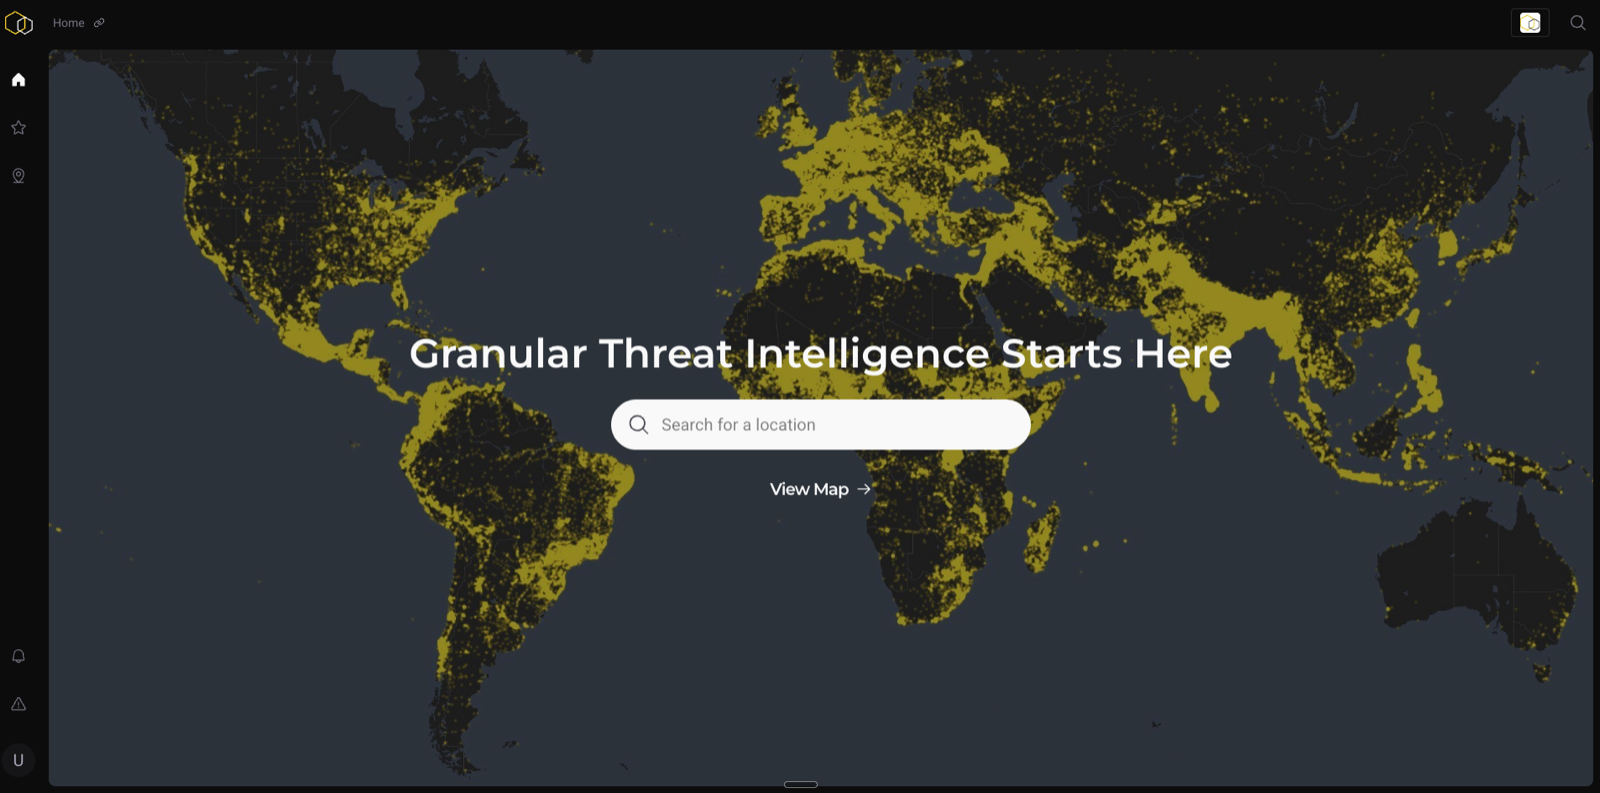
Map (center) — the primary workspace where you search, explore, and visualize data.
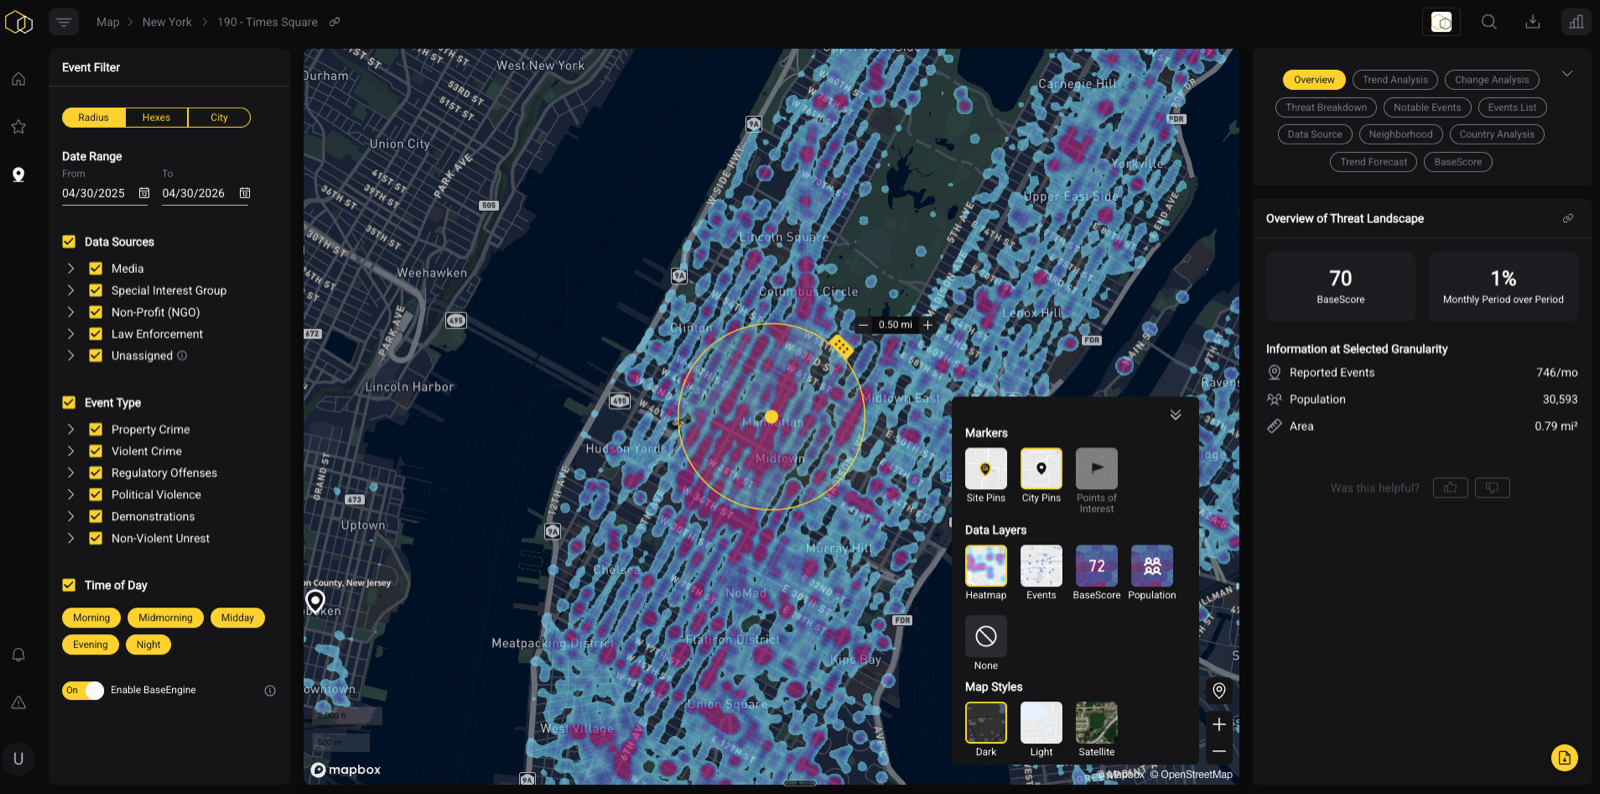
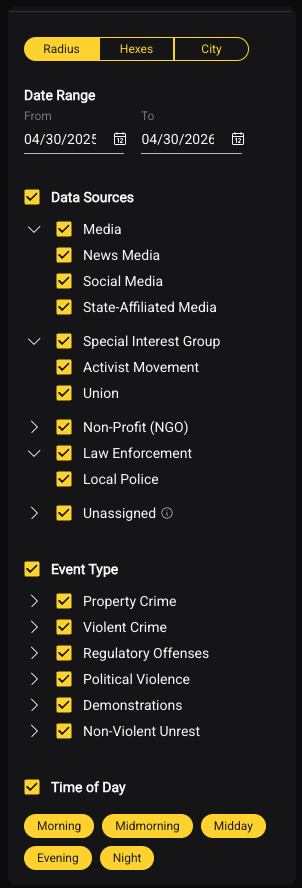
Filter and layer controls — what data is displayed, and how.
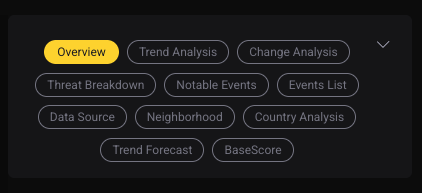
Analytic panel (right) — detailed analysis for the location you are viewing, split across modules you can tab between.
3. Search a location
Click the search bar at the top of the map and type a street address, a city or neighborhood name, or a saved location from your portfolio.
The map centers on that location and automatically loads risk data within the default radius. Try somewhere you know well — your own office is a good first test, because you can sanity-check the result against what you already know.
4. Read the score
The analytic panel populates with the BaseScore for that location and radius — a number from 1 to 100.
The platform shows the number only
There is no tier label in the platform. To turn the number into a risk tier, use the table on The BaseScore scale — that page is where the labels live.
A score on its own is not the analysis. Two things to check immediately:
- Which tier the number falls in. 72 sits in the High band. Look it up here — and quote the tier alongside the number whenever the score goes into a document.
- The breakdown. Which categories are driving the score? A Medium score driven by property crime is a different situation from a Medium score driven by violent crime.
5. Adjust the radius
The radius control changes the area of analysis:
| Radius | Use for |
|---|---|
| 0.1 mi | Immediate site perimeter |
| 0.25 mi | Standard site-level view |
| 0.5 mi | Walkable surroundings |
| 1 mi | Broader neighborhood context |
Tip
Start at 0.25–0.5 miles for most site assessments. Use 1 mile for neighborhood context or when comparing nearby locations.
Where to go next
- Save your locations — Adding a location, then My Locations dashboard for the portfolio view
- Go deeper on a single site — Analytic modules
- Produce something shareable — Generating reports
- Understand the score properly — What BaseScore measures