My Locations dashboard
Your portfolio-level view — every saved location and its current risk status on one screen.
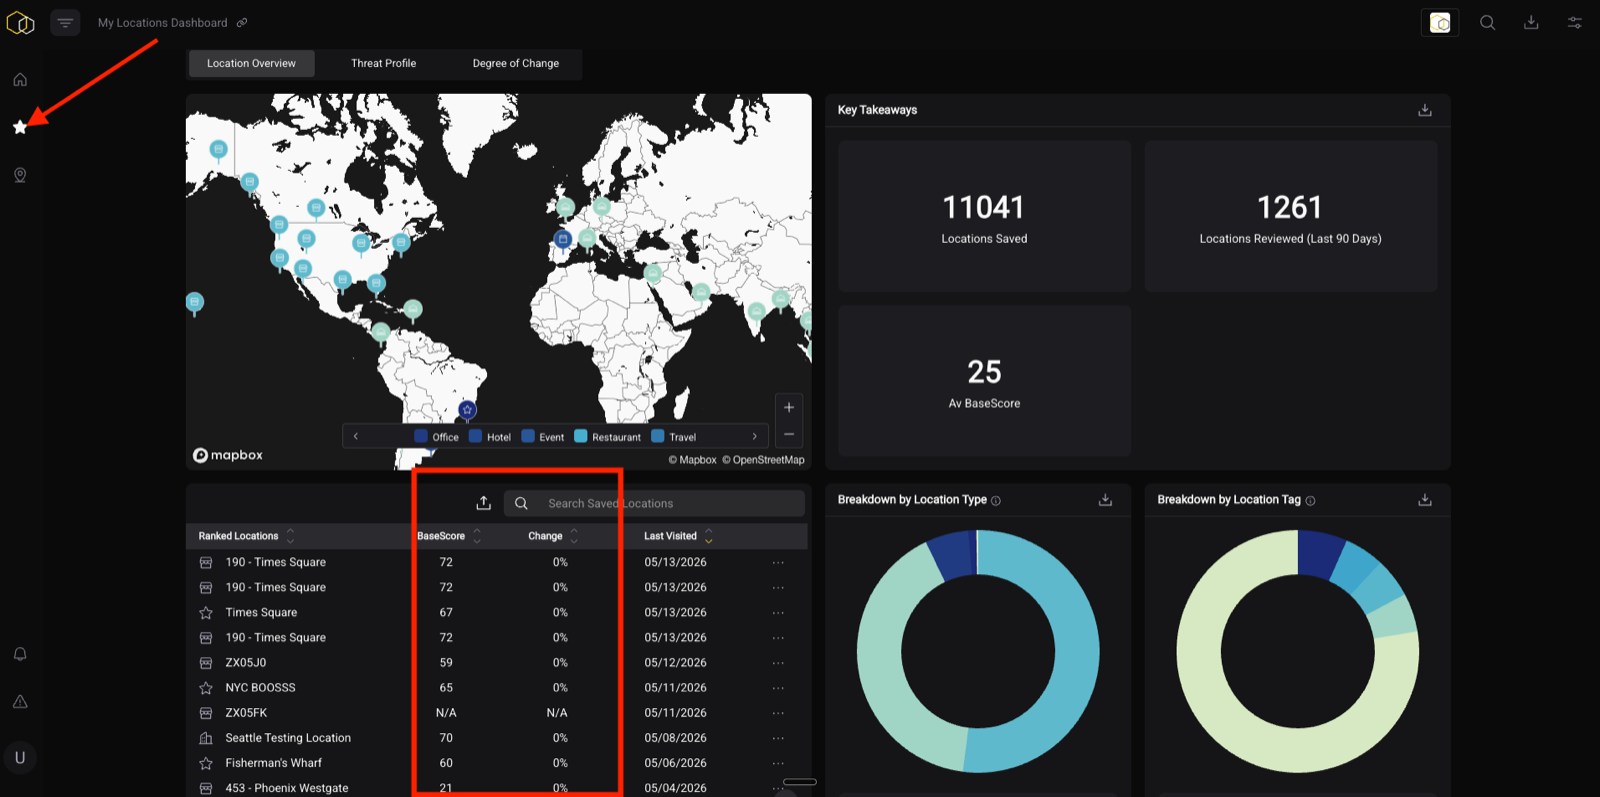
The My Locations dashboard is your portfolio-level view — a single screen showing all of your saved locations and their current risk status.
What You Can See at a Glance
For each saved location, the dashboard shows: - Location name and tags - Current BaseScore and tier - Change % (most recent 12 months vs. prior 12 months)
Sorting and Filtering
Click any column header to sort. Useful sort orders: - Sort by BaseScore to find your highest-risk locations immediately - Sort by Change % to surface locations trending in the wrong direction — these are your early warning signals
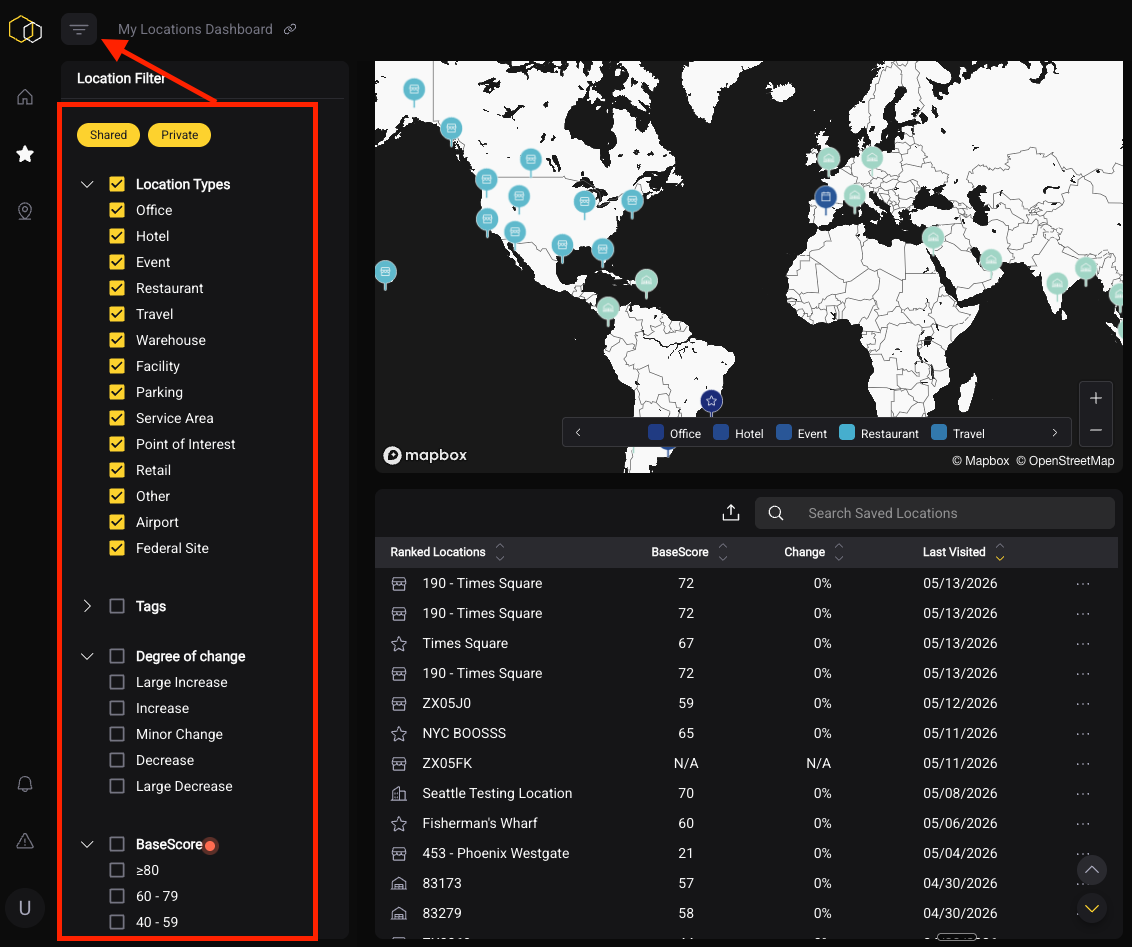
Filter the dashboard by tag to focus on a subset of your portfolio (e.g., view only Texas sites, or only Tier 1 locations).
Bulk Upload
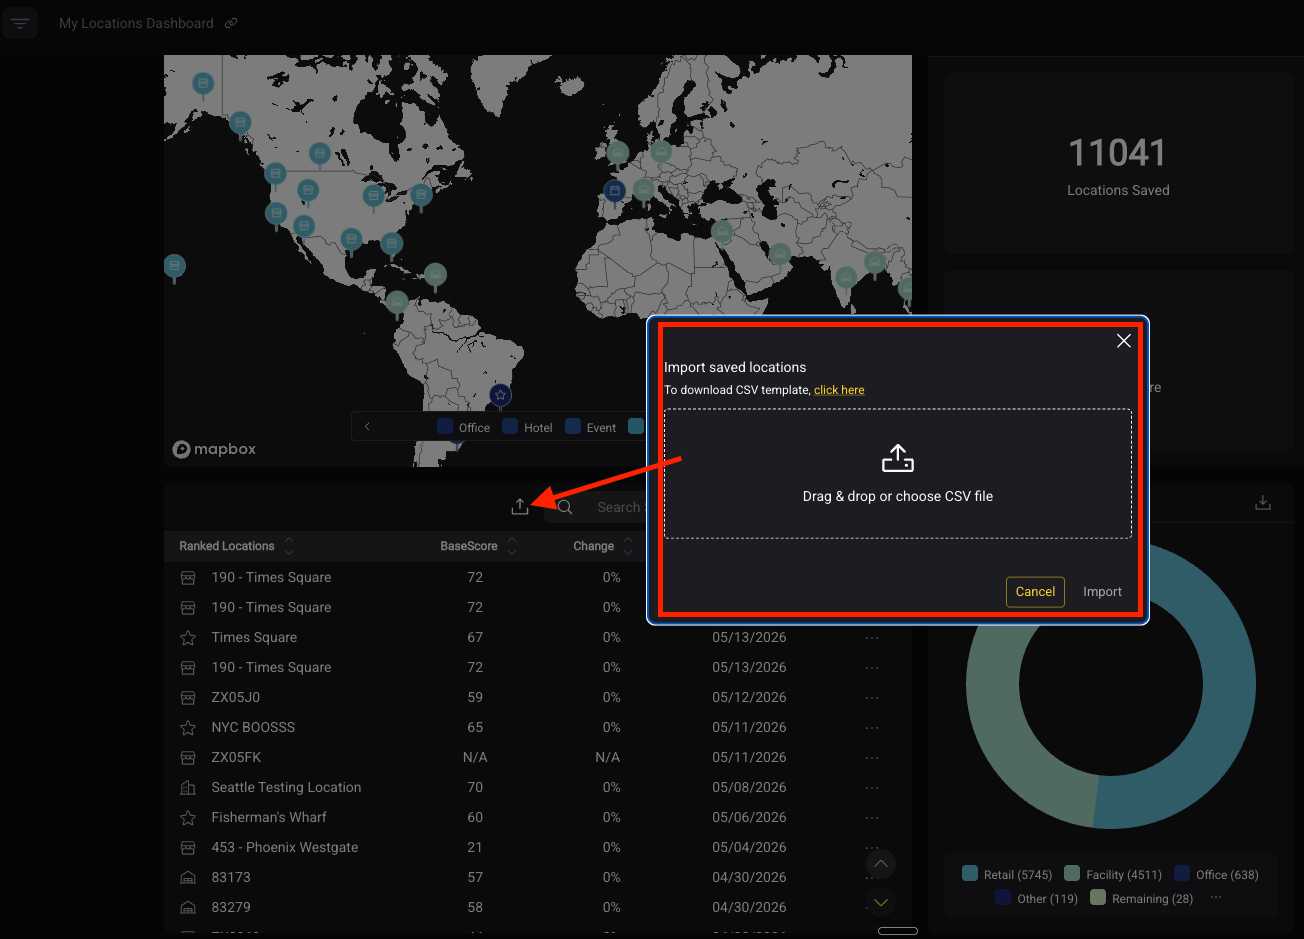
Instead of adding locations one by one, you can upload your full portfolio at once: 1. Download the CSV template from the My Locations dashboard 2. Fill in the required fields: Location Name, Address (or Latitude/Longitude) 3. Optionally add: Location Type, Tags 4. Upload the completed CSV
Tip: You don't need lat/long if you have a street address. The platform will geocode it automatically. Lat/long is only necessary for sites without a standard address.
Talk to us before a large upload
You can do this yourself, but for anything beyond a handful of sites it is worth contacting your Customer Success Manager or support@baseoperations.com first.
Two reasons. Your agreement may include a limit on monitored locations, and it is better to know that before you upload than after. And we can QA the list for you — geocoding checks catch addresses that resolve to the wrong place, which is far easier to fix before the locations are live than after they are in reports.