Analytic modules
The right-hand panel breaks a location down into modules. This is where the analysis actually happens.
The right panel populates automatically when you're viewing a location. It contains several modules — scroll through them or navigate using the module tabs.
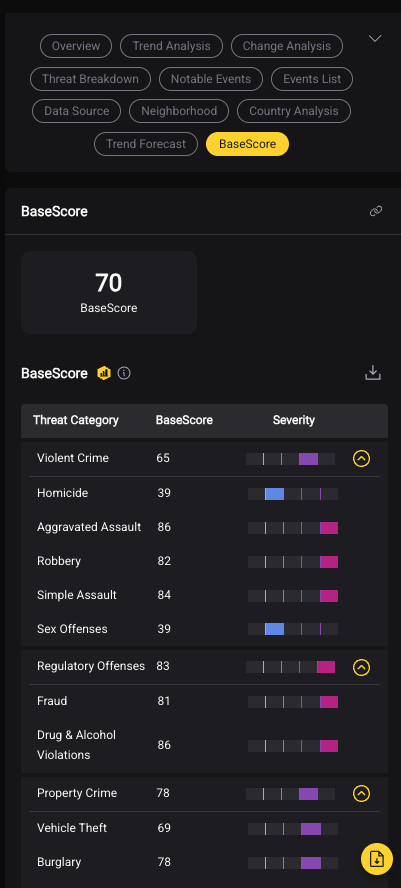
BaseScore Breakdown
Shows the score decomposed by event category. The highest sub-scores are the primary risk drivers. Use this to understand what is driving risk, not just how much risk exists.
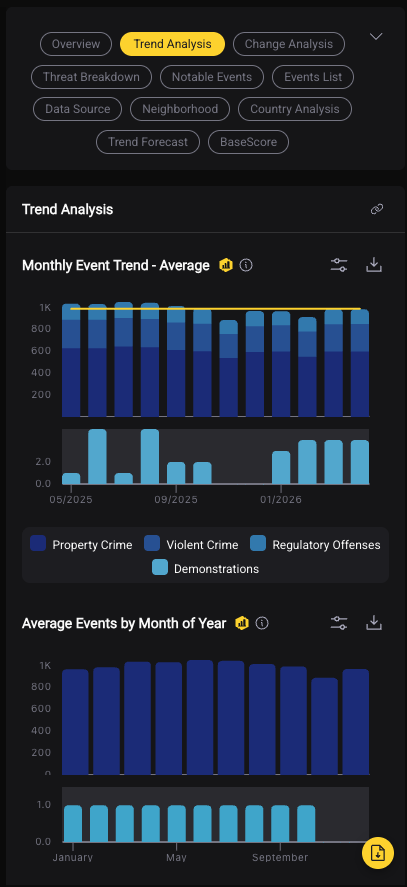
Trend Analysis
A time-series chart showing incident volume over time. Answers: is this location getting better, worse, or staying the same?
- The trend line shows volume across your selected date range
- Spikes indicate elevated periods; sustained elevation is more meaningful than a single spike
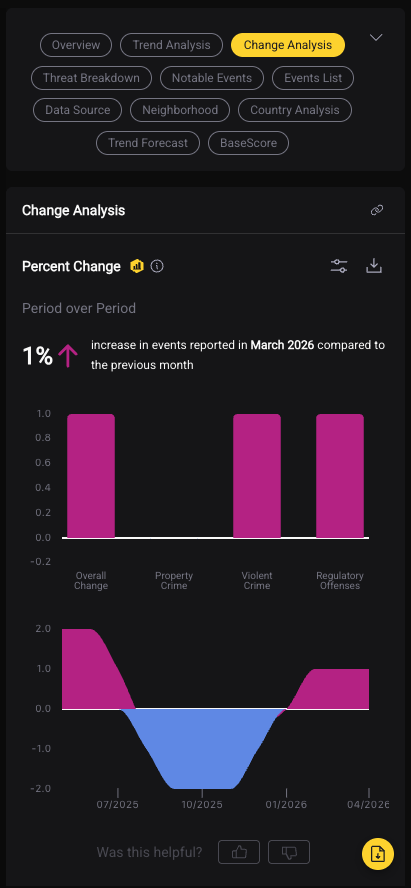
Change Analysis
Compares two time periods directly — typically the most recent 12 months vs. the prior 12 months. Shows: - Percentage change in overall incident volume - Category-level change (which types went up or down)
A location can have a High BaseScore but be trending strongly downward — the change analysis surfaces that.
Threat Breakdown — Events List and Notable Events
Two complementary views:
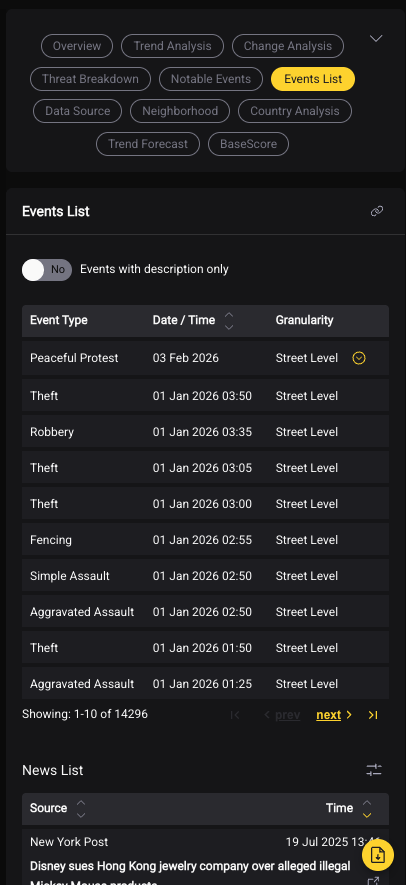
Events List — a filterable, scrollable list of all incidents within your selected radius and date range. Each event shows the date, type, and brief description. Use this to understand what's actually happening on the ground, not just the aggregate score.
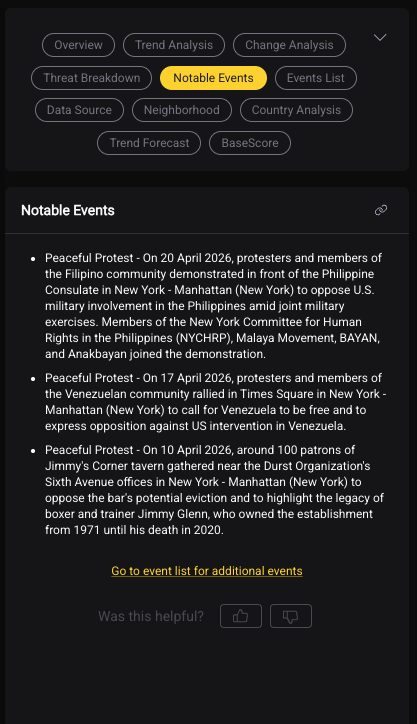
Notable Events — a curated subset of higher-severity or operationally relevant incidents. Useful for executive summaries and leadership briefings.
Data Source
Shows which data sources are contributing to the analysis for this location, as a monthly breakdown by source type — law enforcement, media, NGO, government, and so on.
This is the module to open when you want to know how much confidence to place in a location's data. A location supported by many contributing sources reads differently from one supported by few.
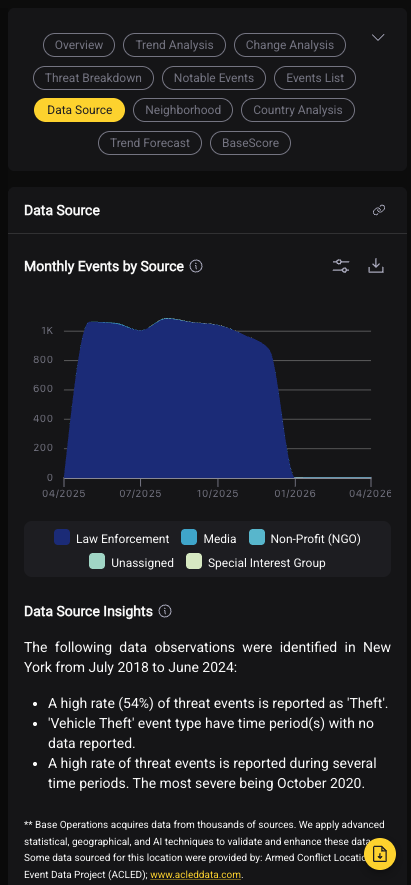
It also surfaces Data Source Insights — plain-language observations about the data itself, such as a category that dominates reporting at that location, or a period with no data reported. Those caveats are worth reading before you quote a figure from the location.
Country Analysis
A separate module on its own tab, and a different kind of analysis from everything else in the panel. Where the other modules describe the area around your location, Country Analysis describes the country it sits in.
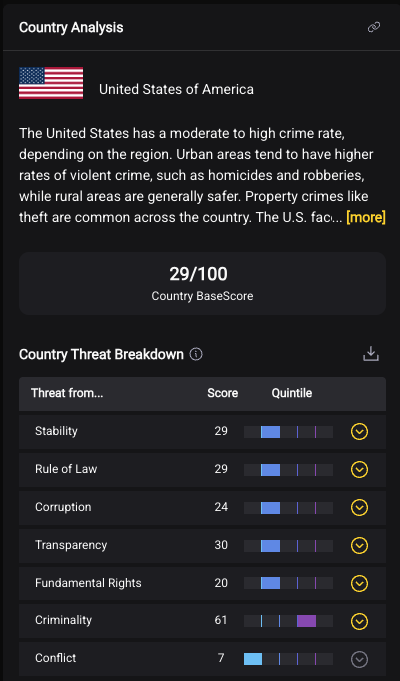
It gives you three things:
A written country overview — a plain-language summary of the national threat picture: where risk concentrates, how urban and rural areas differ, which crime types are common.
A Country BaseScore — the country scored 1–100 on the same scale as a location. Useful as a baseline: a site scoring well above its country's score is an outlier within that country, which is a different statement from being high in absolute terms.
A Country Threat Breakdown — the country scored across seven dimensions, each with a score and a quintile band showing where it falls globally:
| Dimension | What it covers |
|---|---|
| Stability | Political and social stability |
| Rule of Law | Strength and consistency of legal institutions |
| Corruption | Prevalence of corruption |
| Transparency | Openness of institutions and information |
| Fundamental Rights | Protection of civil and human rights |
| Criminality | Prevalence of criminal activity |
| Conflict | Presence of armed or political conflict |
These are country-risk indicators, not crime categories — they do not map onto the crime taxonomy, and they answer a different question. A country can score low on Criminality and high on Conflict, or the reverse.
Where this earns its keep
This is the module for travel risk and executive protection work, and for briefing a stakeholder who knows a country by reputation but not the specific city. It also gives you a defensible answer to "is this site unusual for the country, or is the country just like this?" — a question a site-level score alone cannot settle.
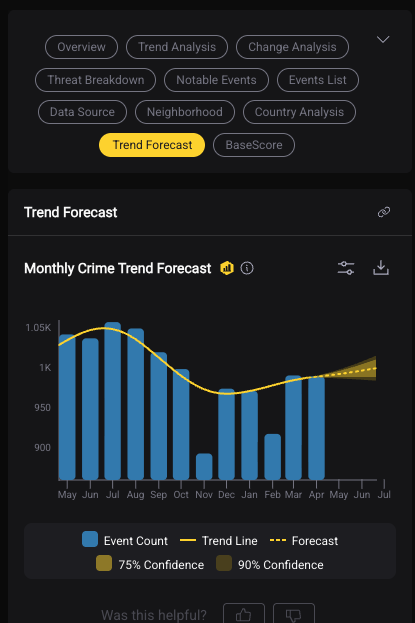
Trend Forecast
Projects incident trends forward based on historical patterns. Provides a directional indicator of where risk is heading — useful for proactive planning rather than reactive response.
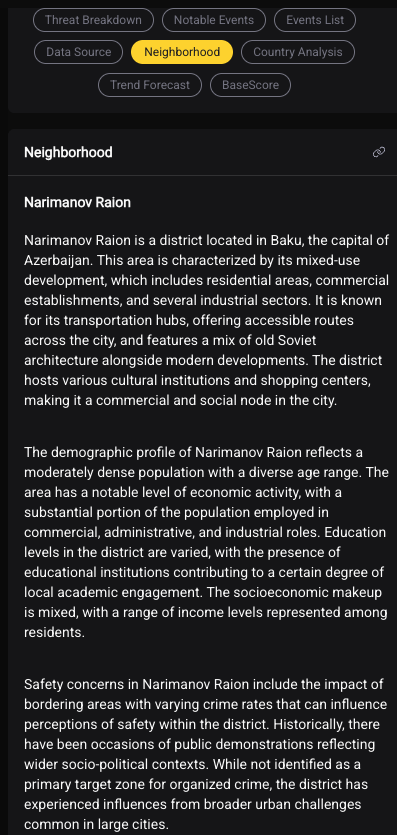
Neighborhood Module
Provides context on the broader neighborhood or area surrounding your location — how your site's risk compares to the surrounding area at the neighborhood level.
Exporting Data
Each module includes export options: - Export as image — downloads a chart or visualization as a PNG; ready to drop into a report, deck, or email - Export as CSV — downloads raw event data or score data as a spreadsheet for further analysis in Excel or other tools
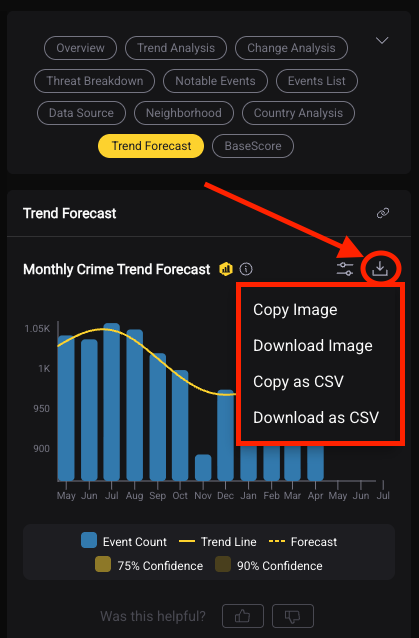
Tip: Use image exports for leadership presentations and client deliverables. Use CSV exports when you need to do your own calculations or combine data from multiple locations.